
Contents
Find it regularly Technical analysis of the price of Bitcoin (BTC) and other iconic cryptocurrencies such as Ethereum (ETH). But also videos to introduce you to some technical indicators, tips or more fundamental approaches. All this with the aim of remain clear and accessible to enable you to learn the basics of trading. And to benefit from advanced analysis by experienced traders.
In this new technical analysis of the cryptocurrency industry, the Bitcoin situation will be discussed first in weekly and daily time units. With the possibility of a rebound towards $ 25.000, yet to be confirmed. And then we will also talk about Ethereum and the BNB cryptocurrency.
Bitcoin - Possible Bounce to $ 25.000?
In weekly time units, Bitcoin hasn't offered much to say for several months now. With BTC still in its range, stuck between the $ 18.500 support and the $ 25.000 resistance. A lower level that was first tested in mid-June this year. And after the rebound to $ 25.000, a price that has stagnated at around $ 20.000 since last August.
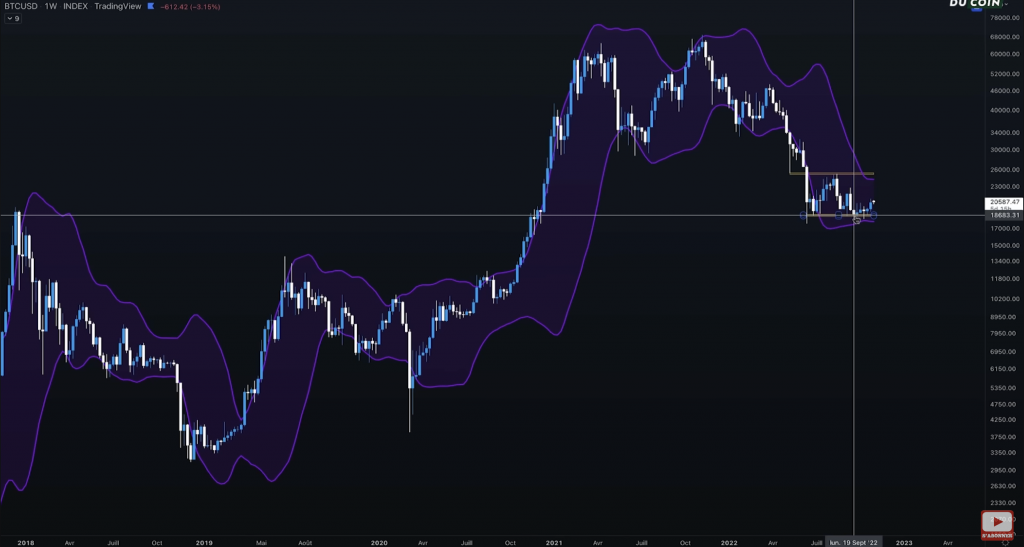
However, a short-term buy signal appeared on the Bitcoin price last weekin a daily period of time. But this is not really visible on the weekly chart. Because BTC is still in its range. With perfectly flattened Bollinger bands. But, after closing last week, a possible rebound attempt. With, why not, a return to the $ 25.000 resistance level. This does not allow us to project ourselves over the long term at the moment, because it would be necessary to break this fateful level first.
Bitcoin - Buy signal in the daily timeframe
A much clearer situation in the daily time unit. Why in this case you can see this famous buy signal that occurred last week. With $ 18.500 support tested multiple times since this range was created. And a last buy signal in the daily time unit obtained around July 18th. This followed a breakout from the top of the Bollinger Bands and a breakout from the top of the last two highs. But all this in a clearly bearish pattern.
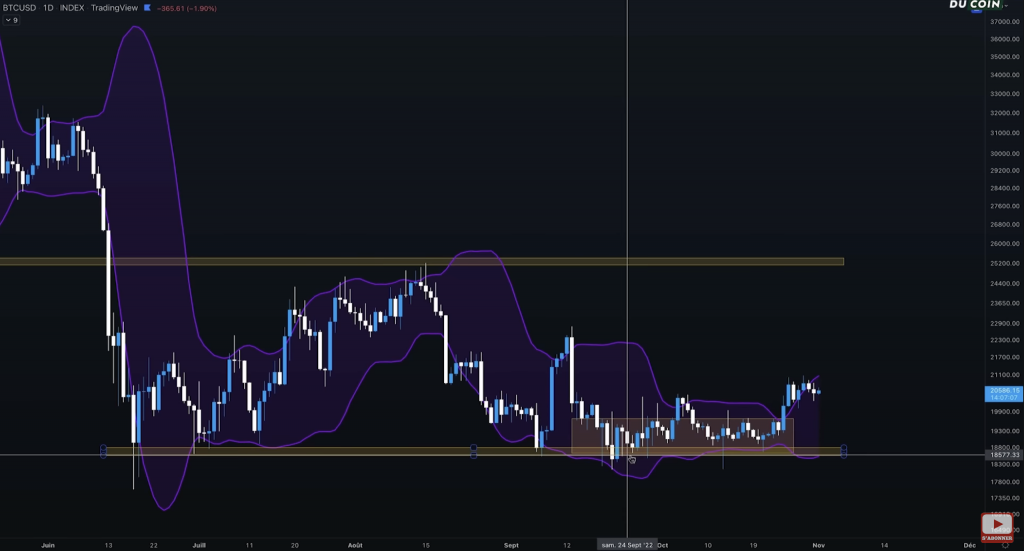
In this case the situation is different. Because this buy signal has just been issued following a prolonged range situation. That is, a period of consolidation more distributed over time and, consequently, much narrower Bollinger bands. A lack of volatility that clearly favors this bullish movement for the moment still in the short term. Knowing that under the CryptoFund by Coin Trading, this buy signal corresponds to a 100% yield in cryptocurrencies especially in Aether.
Ethereum - Higher invalidation risk
Still in the daily time unit, the buy signal is much more evident on the Ethereum side. With a former resistance turned support, located at the $ 1250 level. And since its rebound on the $ 2000 resistance, a period of consolidation that stretched between two perfectly flat Bollinger bands. With, on Tuesday 25 November, a strong impulse candle to put an end to this situation.
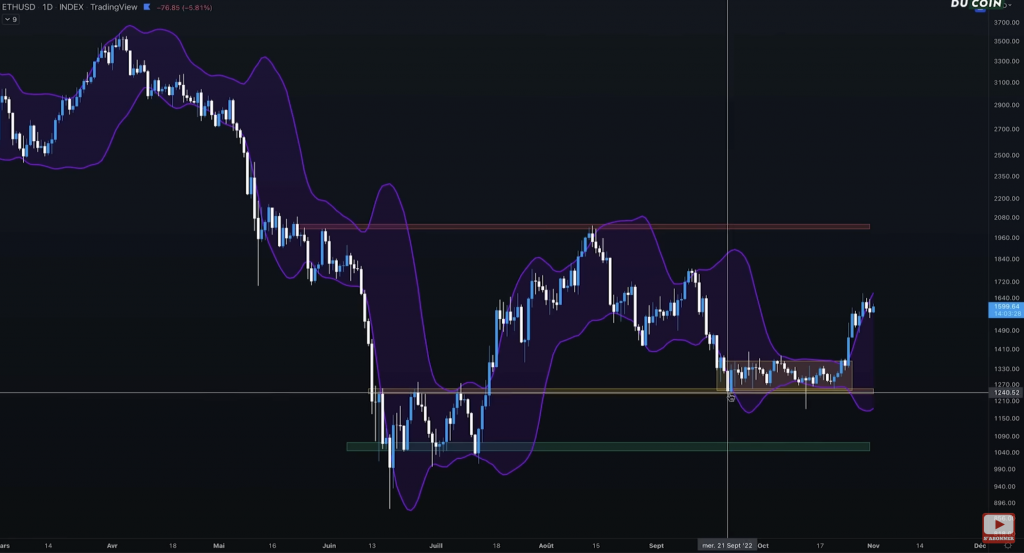
An almost perfect buy signal, as it accumulates a lot of data to validate its implementation. With a price that was much more expressed in the case of the ETH cryptocurrencyafter a change from 1400 to over 1600 dollars during this period. And a position that is favored to buy, probably towards the $ 2000 resistance. Although the risk of invalidation is higher than with Bitcoin, because the rise recorded in the last few days has been greater.
Knowing that in both cases (BTC and ETH) a reintegration of the polygon would mark the end of this energy surge.and the ability to visit even lower levels.
NBB - Waiting for a possible consolidation
In the case of the cryptocurrency BNB, its support level (around $ 260) was in May 2021. The latter has been tested numerous times in the last few months alone. With Bollinger bands tightening and volatility dropping significantly. That means the perfect configuration to see this bullish impulse candle emerge, which also occurred on Tuesday 25 October. With a price that has gone much higher than Bitcoin and even Ethereum.
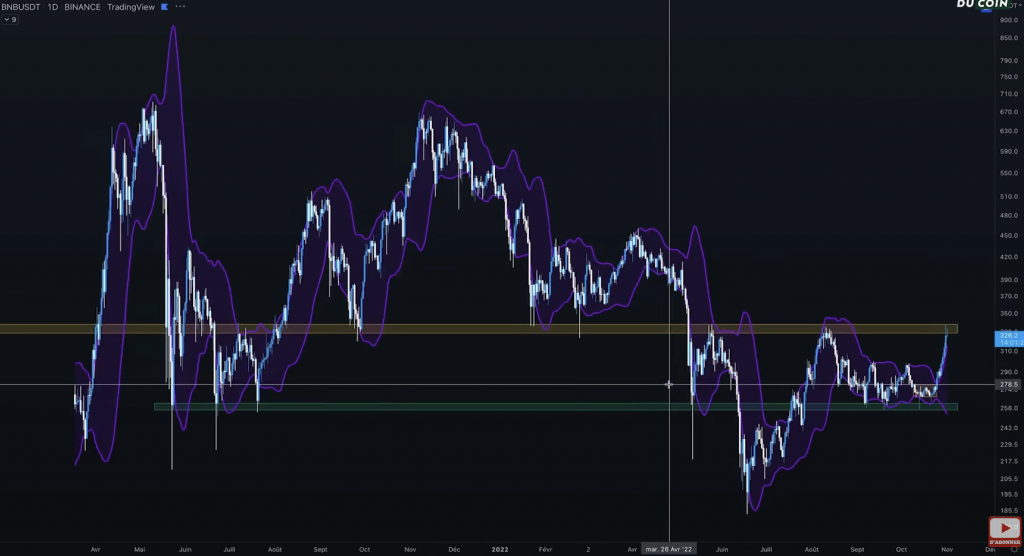
In fact, the price of the BNB cryptocurrency is already sitting on its resistance level at around $ 330. The latter has been tested several times since last May. This makes entry into this cryptocurrency much more complicated, as the level of disability is extremely low. And even if the sense remains the buyerThis does not mean that we must immediately take a stand. With, at least, a consolidation to wait below this resistance to see how the situation evolves.
TOTAL2 / BTC - Very interesting configuration
Finally, a quick look at the TOTAL2 / BTC chart which allows you to define the performance of altcoins relative to Bitcoin. With, in the weekly time units, also a very interesting pattern. Because the curve of the cryptocurrency market, excluding BTC, seems to be heading once again towards its historical resistance, in place since 2018. With a range installed since mid-May 2021. And the prospect of a new test of this fateful level.
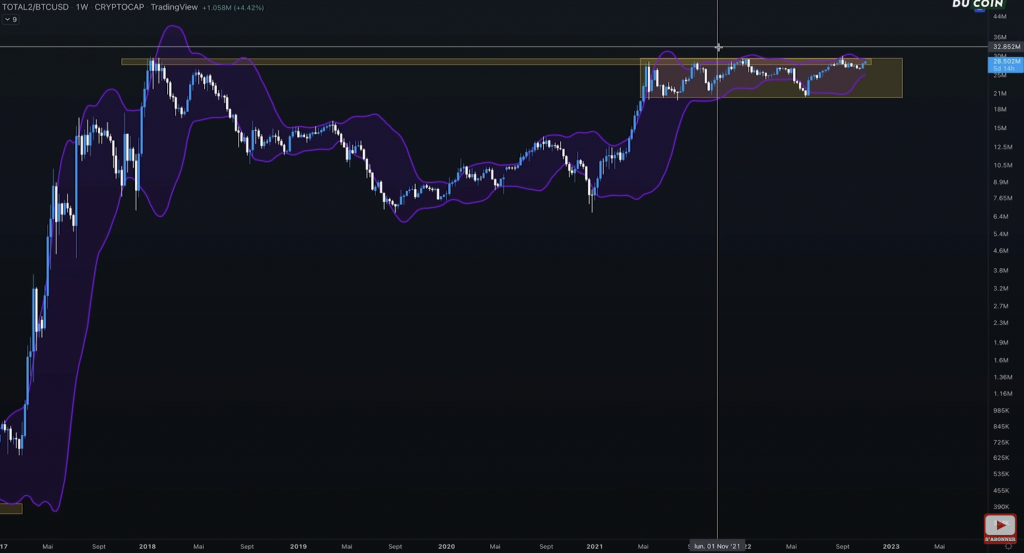
Knowing that in this new case of the figure, a difference in size should be noted. This with Bollinger bands that for once are very narrow. With subsequent tests much faster and more frequent. And the same prospect of breaking that level of resistance once and for all in order to see altcoins definitively surpass Bitcoin. And so we enter a new period of the bull market. But for the moment there is nothing to get excited about, because there are still many signs to validate this option in a more secure way.
