
Contents
In the wake of the latest inflation data in the US, slightly above estimates, we might have thought that Bitcoin was approaching the lows of the year. Only a few hours after the publication of the economic statistics, it took a huge leap back to almost $ 20.000. So much so that it seems like the last hope for buyers.
The explanations for this turnaround are still unclear. Some investors speculate that sellers are buying back their positions. Others, on the other hand, link it to a reaction linked to technical indicators in the oversold zone. Nonetheless, the BTC bear market since the last ATH in November 2021 continues to dominate.This despite a potentially favorable technical signal.
In a market context, this would make us want to close the screens, let's see what the latest technical analysis has in store for us in weekly and daily units.
Bitcoin in weekly units - Fourth consecutive week around $ 20.000?
Bitcoin's status quo around the $ 20.000 mark could continue for the fourth consecutive week. Meanwhile, prices are close to the descending line. With the possibility of a breakout that would send a positive technical signal to buyers. However, given the numerous resistances to be broken on the upside, there would still be a long way to go to open the door to an upward trend reversal.
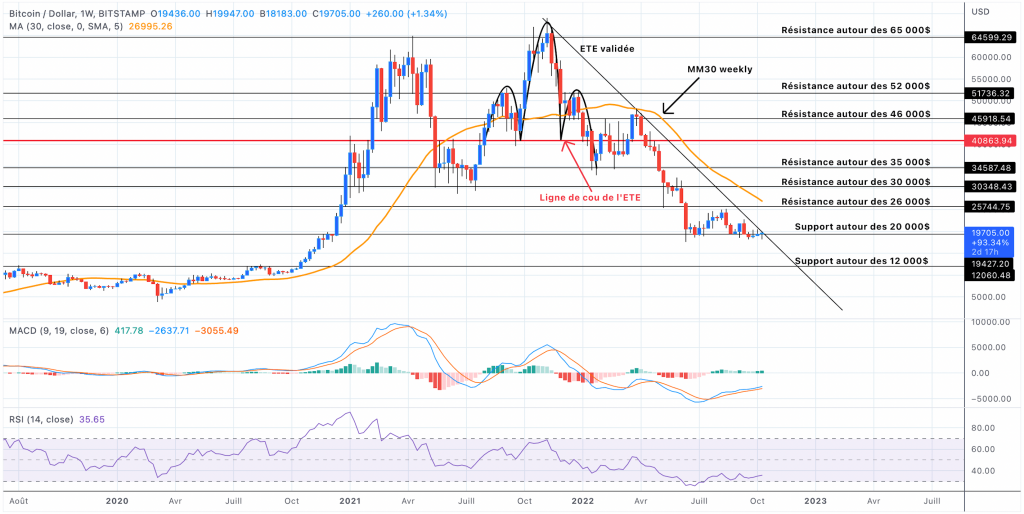
Therefore, it would be imperative that the technical indicators return above their respective waterlines. To do so, BTC prices would have to move away from the $ 20.000 mark and break through the $ 26.000 and $ 30.000 resistance levels. And we must admit that we are far from it. Worse still, Weinstein Phase 4 could be a powerful lure against rebound attempts.
Assuming Bitcoin prices are above the descending line in the coming weeks, would quickly collide with the downward dynamics of the 30-week moving average (MM30 weekly) from the end of March / beginning of April. Especially since he would play the role of double resistance with the $ 26.000.
But on the other hand, buyers would see the birth of a potentially bullish chart pattern that goes by the name of double bottom. Although at this stage this market scenario would not be unanimous.
Bitcoin in daily units - A potential descending line crossing with question marks
In daily units, we observe training a hammer during Thursday's session.which, as a reminder, is often heralds a turnaround. However, it does not materialize in the usual way. This type of pattern usually occurs after a series of bearish sessions or in the context of an extremely excessive bear market.
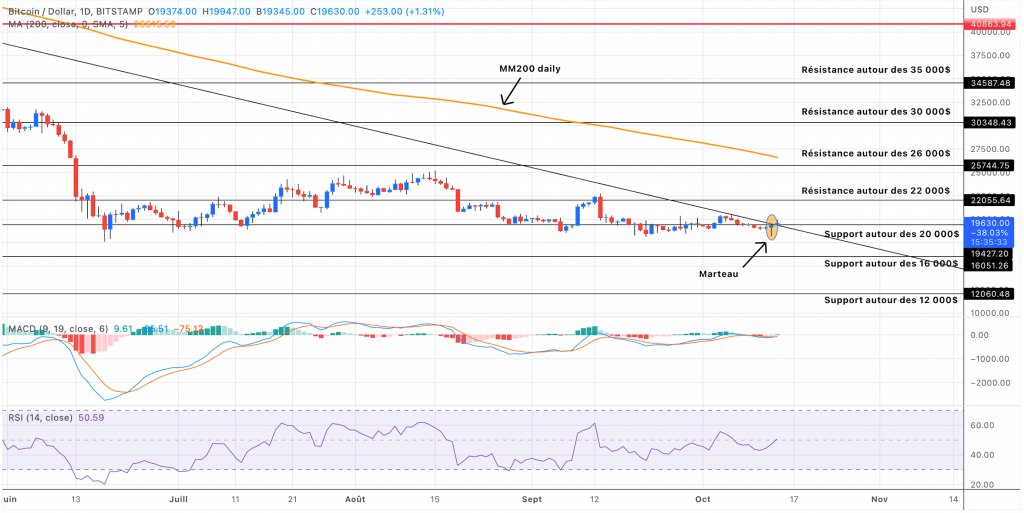
Specifically, in our case, the hammer follows a gamma very tight from mid-September. Therefore, we would remain cautious about the potential breakout of BTC prices beyond the descending line. That said, we cannot ignore the bullish momentum of the MACD and the RSI.
Assuming that both technical indicators return above their respective waterlines, we would evoke the possibility of Bitcoin returning to $ 26.000 in addition to the violation of the descending line and the $ 22.000. But as with the weekly MM30, Satoshi Nakomoto's digital currency would have a lot to do with the 200-day moving average (MM200 daily) to try to climb.
BTC - One Last Chance to Avoid a Bear Market Rally?
Following the release of US inflation data from September, which reinforced the Fed's continued monetary tightening, there was a pivotal case where Bitcoin dipped below year lows. Nevertheless, There has been an upward reversal, but it is relative as prices have remained in a tight range since mid-September.
In any case, this would appear to be the last chance to delay the BTC bear market recovery since its last ATH in November 2021. For this to happen, prices should quickly break through the resistances mentioned in the previous section or even the $ 30.000 mark. The only condition is that Positive fundamentals, such as falling dollar and falling bond yields, can be sustained over time.
If not, the $ 20.000 break would confirm a new wave of correction, which in turn would send Bitcoin back to supports not seen since 2020, respectively $ 16.000 and $ 12.000 respectively. And in the hypothesis that the market context were to degenerate, We do not rule out the hypothesis of a four-digit price return if the Fed's pivot deadline is postponed.
